Service Design Case Study
NAPA Auto Parts Delivery Promise
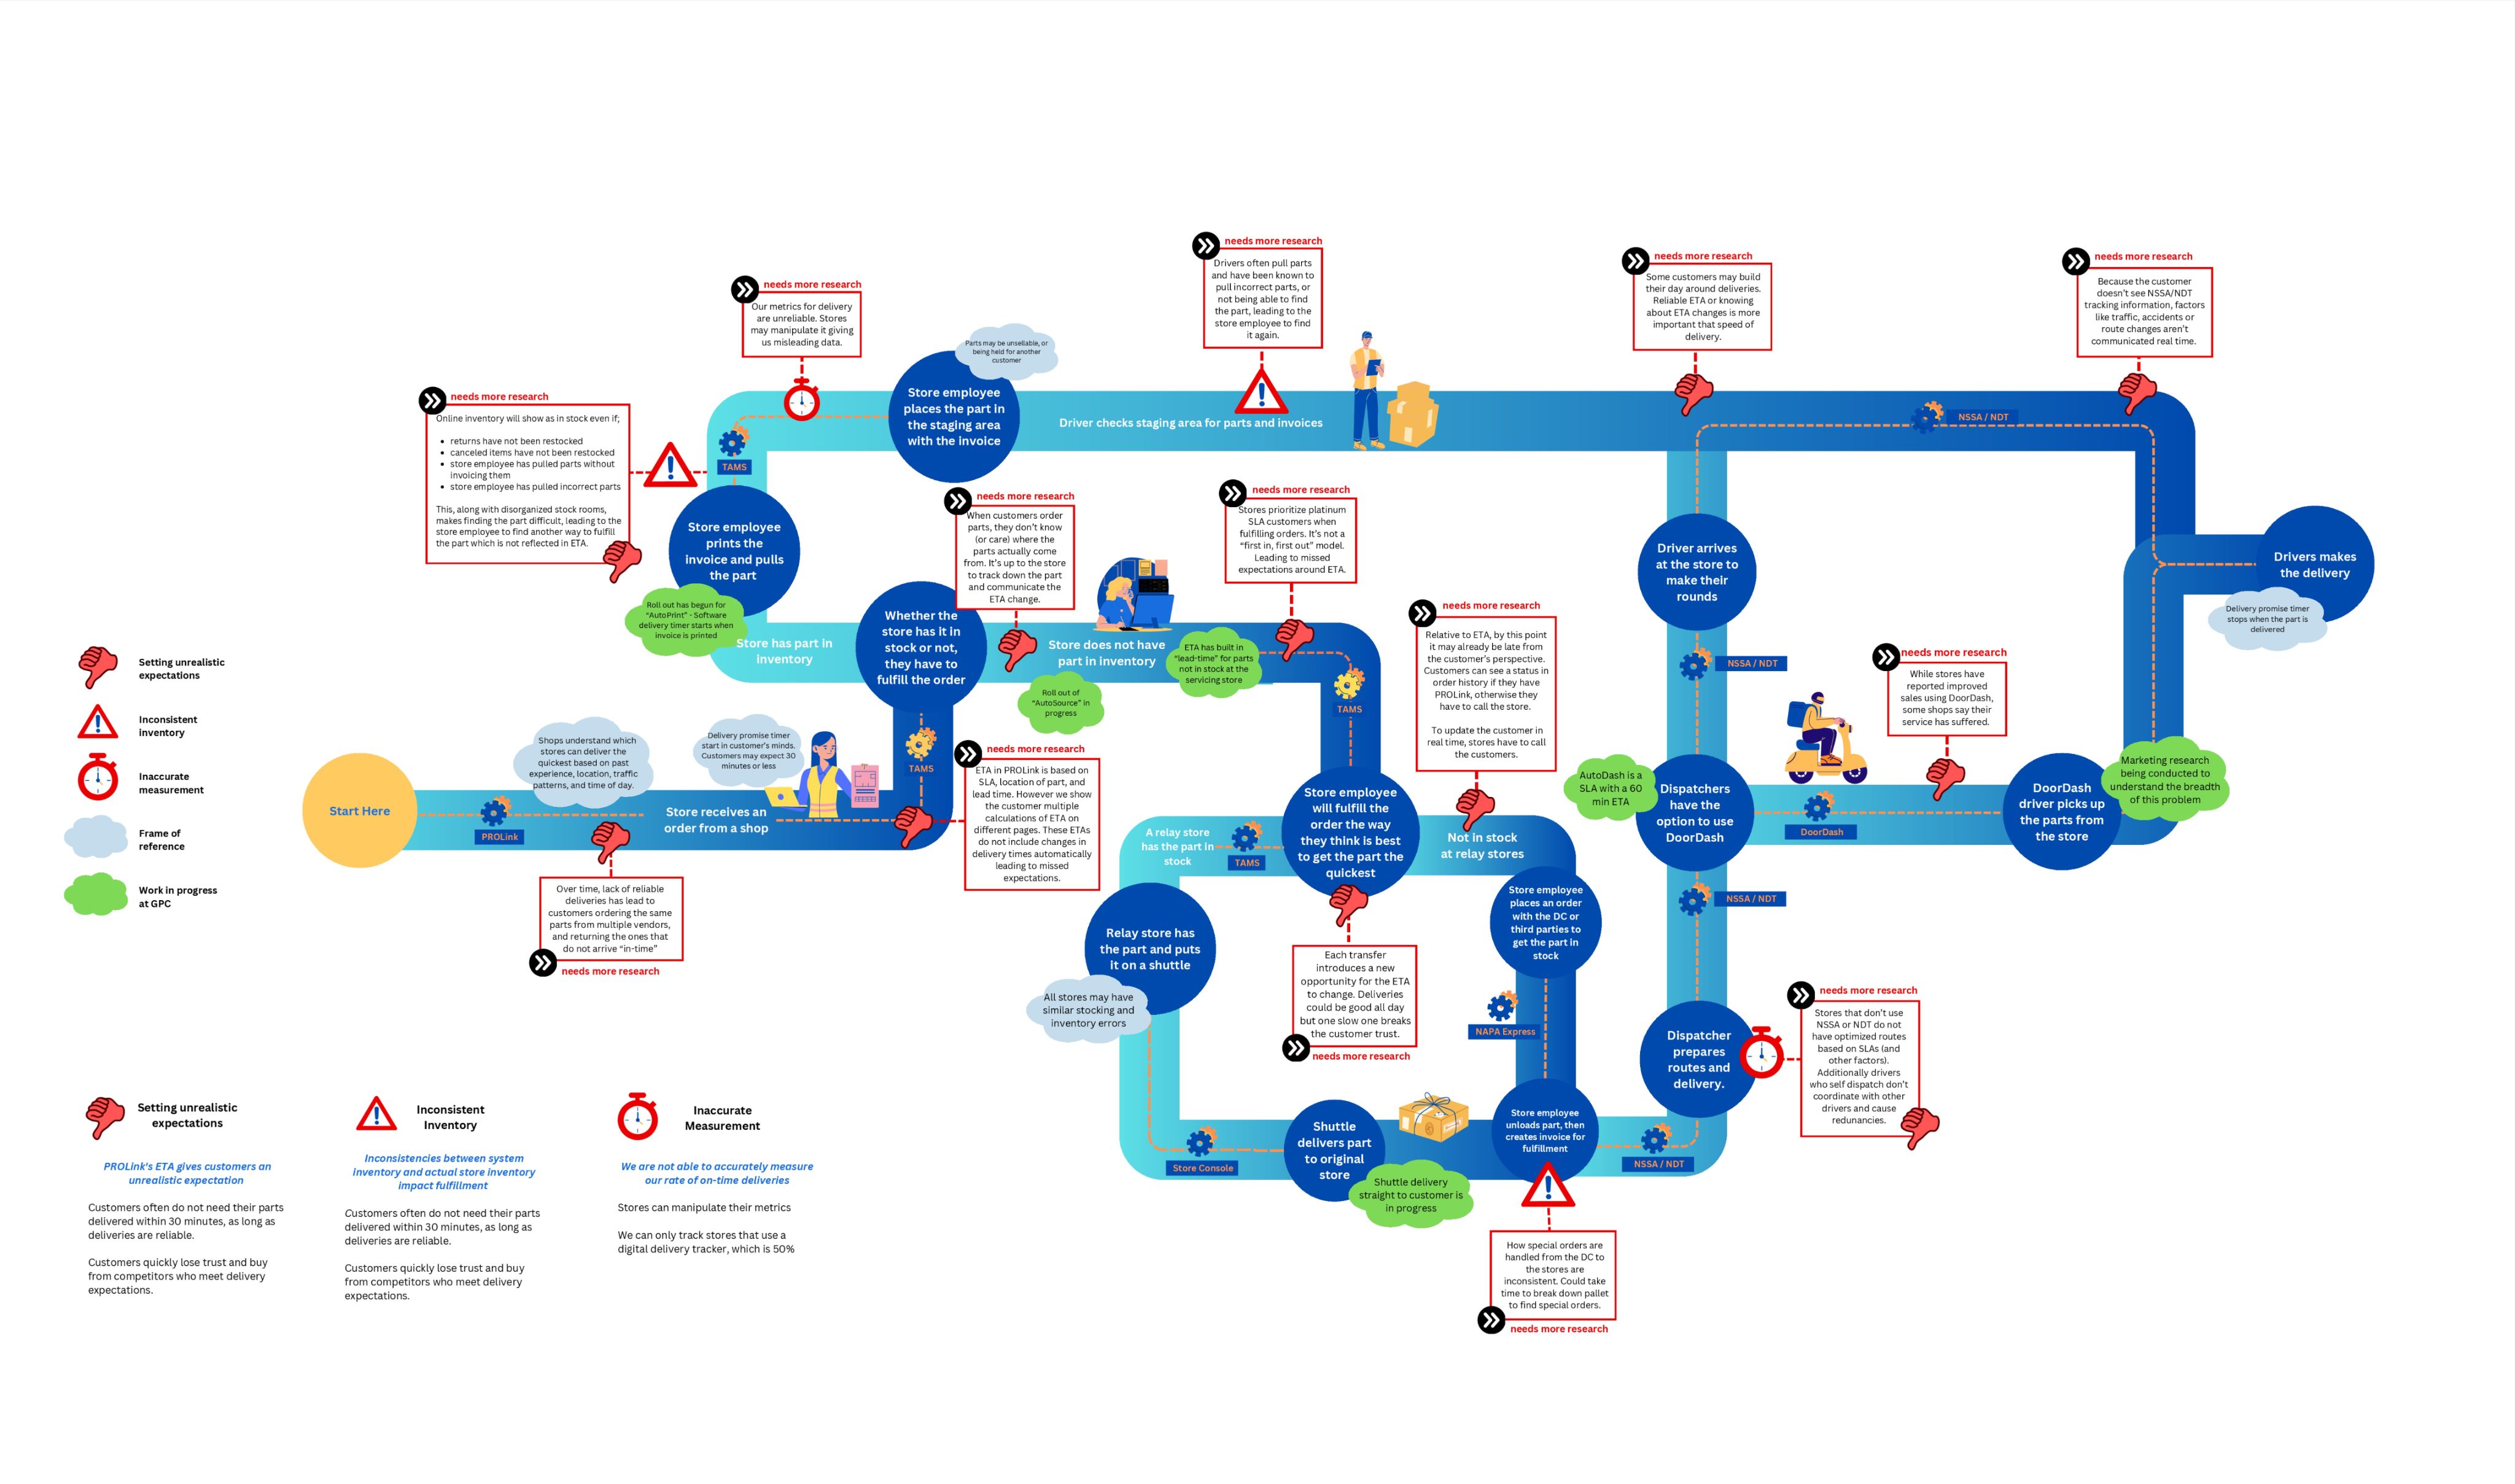
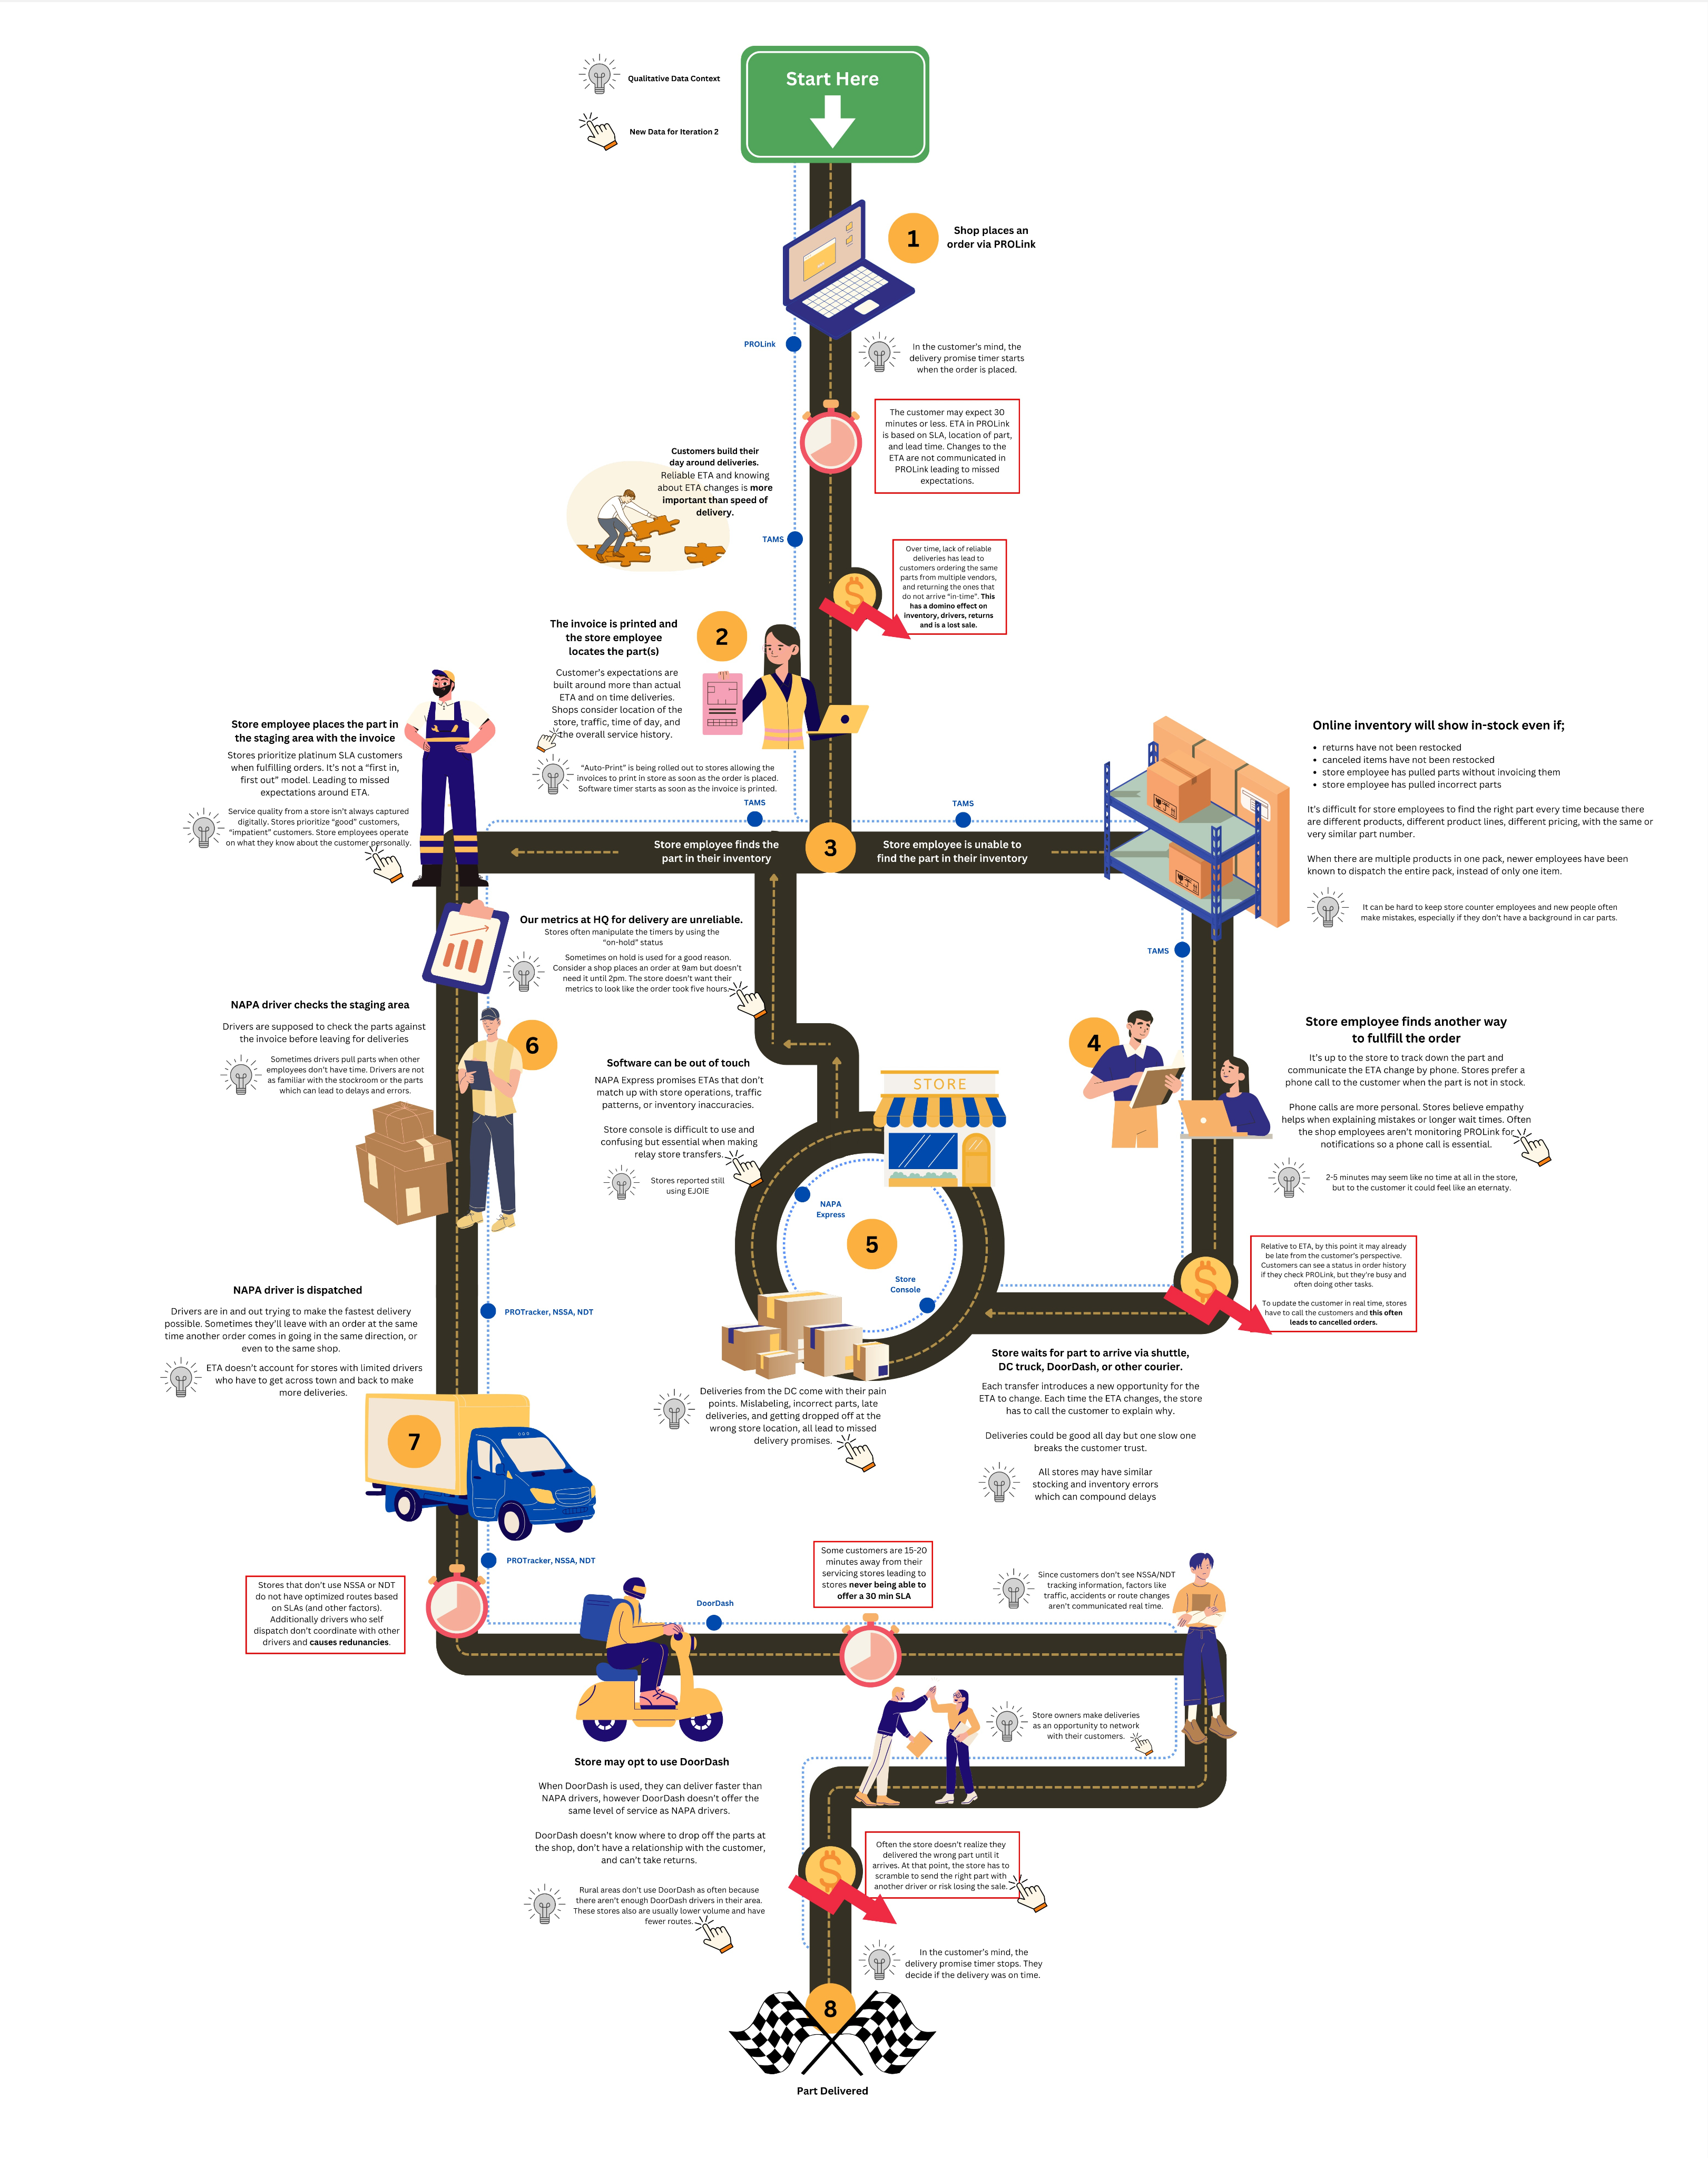
NAPA stores service the auto repair shops in the best way they can by offering various goods and services. One of the biggest offerings is delivery. Through exploring NAPA's ecosystem we were able to identify that NAPA wasn't meeting this service promise of delivering to customers, at the time NAPA stores were promising.
“2 to 5 minutes on our side, our side seemed like no big deal, but 2 to 5 minutes on their time on their side of the time is an eternity.”
NAPA Store Owner
Research Partci